Vision Zero. It’s a bold slogan, and its goal is bolder still: completely eliminating traffic fatalities. No more road deaths — ever.
The scheme started life in Sweden over two decades ago, and quickly drew international attention with its unusual approach: the policy goal was not to reduce traffic collisions, but to reduce deaths.
And it worked. Since 2006 alone, Sweden has reduced traffic deaths from 7 per 100,000 to just 2. And other countries began to follow suit, initiating Vision Zero schemes of their own. That included the US.
But now, several years on, many of these schemes are way off track. Road deaths nationwide are currently spiking and doubt is beginning to set in over the schemes’ effectiveness.
In this article, we’re going to explore:
- Traffic fatality rates in the US
- The Vision Zero mindset
- The mixed results from current Vision Zero schemes
- Why some Vision Zero schemes are working and not others
- What can be done about it
Looking at the US Traffic Fatality Rates
In 2019, the US saw a total of 36,096 traffic deaths, and has seen similarly high numbers in previous years. So what are the major contributors to these high rates?
Over the past decade, gas prices have fallen by a whopping 40%, meaning it’s easier and cheaper than ever to be out on the road. Distracted driving has soared with our increasing reliance on cell phone usage. And rising sales of heavy-duty SUVs means the collisions that do occur are more likely to cause serious injuries and deaths.
Work zones and lane closures also pose significant risk, particularly when the public is unaware of their existence. There were over 115,000 work zone related road crashes in 2019, resulting in over 39,000 injuries and 842 fatalities.
Furthermore, according to recent data, urban areas are where the majority of fatalities occur, and more than a third of vehicle traffic fatalities happen outside the vehicle — that is, they involve pedestrians, cyclists and motorcyclists.
The pandemic has seen a further increase in US road deaths. From the beginning of 2019 to mid-2020, traffic fatalities increased by almost 34%. Why?
The Safety Council’s Statistics Manager, Ken Kolosh, reported that early data from the National Highway Traffic Safety Administration showed speed to be one of the top factors. He also noted an increased use of alcohol, marijuana and opioids across the US as a major impact on fatalities; perhaps unsurprising, given unemployment spikes due to Covid-19.
Motor vehicles cause traffic fatalities, and the number of cars on the roads is increasing year on year. The urgency with which Vision Zero has proliferated speaks directly to that fact. But what makes Vision Zero distinct from generic harm reduction schemes?
The Vision Zero mindset
Vision Zero, in brief, is a strategy with the goal to achieve zero traffic deaths and zero severe injuries.
The ITE explains it in more detail, and identifies its additional target of increasing safe, healthy, equitable mobility for all. This means an approach to traffic management that believes traffic deaths and severe injuries are preventable. To accomplish this we must accept a greater reliance on connected systems and automation to minimize human points of failure.
What does this Vision Zero mean in practice? These are the strategies outlined as essential by the Vision Zero Network on its website:
- Building and sustaining collaboration, leadership and accountability between stakeholders (transportation professionals, policymakers, public health officials, police, and community members)
- Collecting, analyzing, and using data to understand trends and impacts of deaths on certain populations
- Prioritizing equity and community engagement
- Managing speed to safe levels
Setting a timeline by which we can achieve zero traffic deaths and injuries, to create urgency and accountability and ensure transparency on progress.
Vision Zero: mixed results
Now in 2021, 49 communities across the US have their own Vision Zero schemes. Interestingly, however, not all of these schemes are seeing the same levels of success. And as we mentioned above, road deaths are still on the rise.
Chicago, Los Angeles, and Washington DC were three of the first cities to establish Vision Zero targets — yet all three have seen fatalities rise or remain stable. With their current rates of change, none of these cities is on track to reach its ‘zero traffic fatalities in 10 years’ target. In Los Angeles, road deaths have increased by a colossal 80% in two years. And in DC, instead of seeing the 35% year on year reduction required to achieve their zero deaths goal on schedule, there’s been a 40% increase over the 2015 baseline! In this same time period, DC has seen 196 deaths and 1,803 major injuries.
Furthermore, cities such as Austin and San Jose are also looking like they’ll struggle to meet targets after seeing a rise in fatalities since implementing Vision Zero schemes (in 2014 and 2015 respectively). Similarly, the roadside death toll in Seattle has stayed flat for a long time, and it seems unlikely that the city will be able to eliminate traffic deaths by 2030 unless something drastically changes.
On the other hand, some Vision Zero schemes in the US have proved extremely successful.
Let’s take New York as an example. NYC launched its Vision Zero scheme back in 2014. At the moment, every year approximately 3,000 people are seriously injured and 200 die in traffic accidents within the city.
As part of its Vision Zero scheme, the city expanded enforcement against dangerous traffic violations such as speeding and failing to yield to pedestrians. It also created new street designs and configurations to improve road safety, undertook considerable public outreach, and increased penalties for dangerous drivers. MTA Bus and City Fleet drivers have received more training and safety education.
It seems this work has paid off. Since the scheme began, the New York City government has seen dramatic changes. City speed cameras have reduced speeding by over 60% in locations near schools where cameras operate. Even better: traffic deaths have fallen by a third.
In addition to this, New York City has readily available data about lane and street closures, contributing to awareness about work zone activity on the city roads and decreasing the likelihood of collisions.
San Francisco has seen similar success since launching its own Vision Zero scheme in 2014. The city sees a comparably small 30 deaths and 200 serious injuries per year, and is now seeking to eliminate these incidents altogether by 2024. Their action strategy focuses on 4 main initiatives:
- Improving street safety through measures like traffic calming plans and street closures
- Educating people about road safety via training
- Improving vehicle safety by standardizing data and developing guidelines for emerging automated and connected vehicles
- Increasing and bettering data systems across organizations
You can read more about specific plans and strategy points in the Vision Zero Action Strategy PDF here.
Before the spike in 2019–2020, San Francisco had begun to see a reasonably significant decline in traffic deaths. In fact, between 2013 and 2018 deaths dropped by almost a third. Since the scheme began, the City and County of San Francisco has added over 40 miles of sustainable travel lanes, and installed safety treatments on over 9 miles of its High-Injury Network. Those are all enormous victories.
Like New York City, the San Francisco Public Works website also has easily accessible road event and project information available to support their Vision Zero initiative.
Why are Vision Zero schemes working in some areas and not others?
Spending
One might assume that budget and outcomes are closely related. Do states with higher highway spending per capita have more resources available to dedicate to their Vision Zero projects, and therefore see fewer road deaths? We dove into the data to investigate.
The graph below highlights state spending on highways versus motor vehicle traffic deaths by state. Single asterisks mark the states which include at least one city with a Vision Zero scheme in place and double asterisks those with multiple.
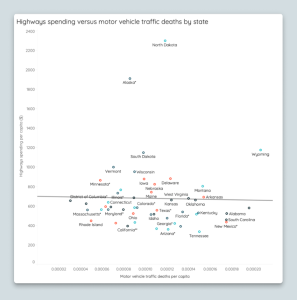
Surprisingly, the data showed little to no correlation. Vision Zero spending and highways spending by state are not identical, but measures to prevent road deaths will almost certainly require highways spending. That goes to suggest that the varied success of Vision Zero schemes is not primarily due to expenditure — and is more likely to be found in examining the attitudes and priorities of stakeholders required to implement VZ schemes successfully.
Acting on Key Targets and Deliverables
Cities like New York and San Francisco, those that have set themselves key deliverables and taken action to meet them, have seen greater success with their Vision Zero schemes.
Nonetheless, other cities like Los Angeles have also put considerable work into analyzing crash data and introducing safety improvements to streets such as pedestrian scrambles, kerb bump-outs, and signal upgrades in LA. The city has also modestly increased speed limits in the hope that the new, higher limits will be more enforceable, curbing aggressive speeding without penalizing the average driver, although whether this is working remains to be seen.
In this case, however, it seems the challenge is engaging the public in order to improve community cooperation with existing strategies. This is likely due to a lack of pre-existing safety legislation before the introduction of the Vision Zero scheme.
Speed of Implementation
Another principal reason that Vision Zero is proving more successful in some areas than others seems to be a difference in implementation, stemming, in turn, from differences in operational and civic priorities between cities.
Despite being one of the first places to set Vision Zero targets, Chicago took five years to draft an action plan, dramatically shortening the time remaining to reach its initial 2022 targets. Washington DC released an action plan promising 0 traffic deaths by 2024 back in 2015 — but has since taken few of the actions promised, with attempts to reconstruct streets being hindered by resistance from community groups or delayed by a lack of coordination between transportation officials.
Coordination between agencies and transportation bodies
One of the central contributing factors to high collision rates, as mentioned earlier, is a lack of accessible, comprehensive work zone and road event data across departmental and jurisdictional boundaries, as well as for the public. To enact and achieve a scheme as ambitious as Vision Zero, transportation agencies need internal cohesion that far surpasses the norm. Given the importance of automation to its success, systemized, centralized data from road agencies is absolutely necessary; it is impossible to identify points of infrastructure or traffic failure, let alone begin to transform them, when dealing with siloed information and lack of coordination between departments.
Washington DOT is a good example. Despite showcasing some of the most comprehensive state-level transportation data in the US, much of it is siloed in spreadsheets, separate maps, or discrete web pages; understanding the full picture of traffic flows, road incidents, work zones, and collisions is almost impossible without compiling reports by hand.
LADOT works in a similar way, meaning that residents are reliant on manually checking LADOT’s website to find out what’s happening on their roads. While a map of memorials to those who have lost their lives in collisions is available, residents are still unable to receive alerts about work zones or road events happening on their doorsteps. There is, then, still scope for all the human error that Vision Zero was originally designed to eliminate.
What more can be done?
While reducing speed limits and making changes to road layouts to encourage sustainable travel are both key to reducing fatalities and collisions, so is raising awareness about the location and timings of work zones and lane closures.
As mentioned earlier, according to data from NHTSA’s replacement Crash Report Sampling System, in 2019 there were over 115,000 work zone related road crashes. Those collisions resulted in over 39,000 injuries and 842 fatalities. Furthermore, The Construction Association’s 2019 highway work zone safety survey revealed that 67% of all highway contractors reported crashes into their work zones over the past year.
One major contributor to the epidemic of work zone collisions is the lack of accessible traffic and work zone activity data. This data exists, but too often is shared on out-of-date websites, or in static or minimally-functional maps, and if the public want to find out about it the onus is on them to put in the work.
That picture is, slowly, changing. Forward-thinking DOTs are beginning to use shared formats like those of the Work Zone Data Initiative, which aligns all work zone data to pre-specified standards. That means the information can be used and shared by third parties, who can layer their services and tools on top to help DOTs manage road events more smoothly — which in turn leads to better coordination, communication, and safety around disruptive highway events. The public are informed automatically about upcoming changes to their roads, meaning the scope for human error is reduced in exactly the way Vision Zero’s architects intended.
Traffic fatalities are a multicausal, multifaceted challenge for Departments of Transportation. There is no silver bullet to eliminate dangerous driving. But one conclusion is beginning to emerge with certainty: if they want to reduce fatalities, road agencies need to start thinking seriously about how they manage their data.
At one.network, we turn work zone and temporary road event data into WZDx-compliant feeds for free. Find out more.


